Students in my Campaigns and Election course (Gov 2060) just read the following article about candidate issue positions in U.S. House elections:
Stephen Ansolabehere, James Snyder and Charles Stewart. 2001. “Candidate Positioning in U.S. House Elections.” American Journal of Political Science 45(1):136-159.
I’ve assigned this article many times over the years because it’s a great analysis of candidate responsiveness to district preferences. Figure 1, for example, looks at the relationship of candidate ideological position (as estimated by candidate responses to the 1996 version of Project Vote Smart’s Political Courage Test) against the district vote for Bob Dole in the 1996 presidential election (used as a proxy for the district’s ideological leaning). Notably, this analysis includes both incumbents and challengers running in 1996.
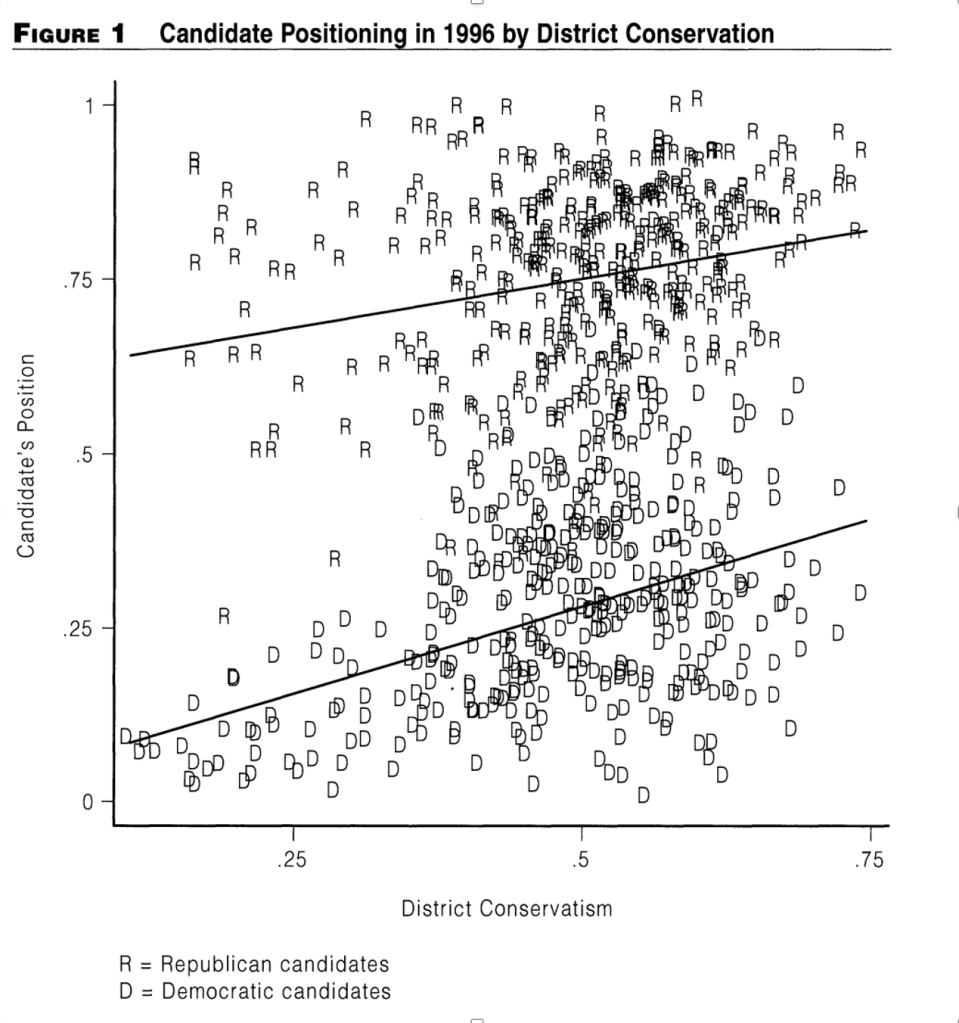
The figure shows that Democratic candidates are always to the left of Republicans candidates (lower on the y-axis), but as the district is more Republican, candidate positions move rightward.
This year, we wondered in class discussions how the results would translate to contemporary campaigns. I grabbed some relevant data (see notes in graphs) and have run some preliminary analysis using data from 2016 U.S. House elections.
First, consider the relationship of a district’s PVI with the ideological position of incumbents running in 2016. As the PVI reflects a more Democratic district (moving to the right along the x-axis), both Republicans and Democrats have more liberal voting records, though there are hardly any Republicans in Democratic-leaning districts (and vice versa). (Ideology is measured from incumbent roll call votes in the U.S. House.). Moreover, Democrats are always to the left of Republicans on the scale.

But what about including challengers? For this, I use CFScores from Adam Bonica’s DIME project. These estimate ideology scores based on clusters of campaign finance donations across candidates. This is different from how the authors in the assigned article estimated ideological positions of candidates in 1996. First, consider the same graph as above, but with challengers included (and replacing NOMINATE estimates for incumbents with their CFscore). (Notably, the correlation of DW-NOMINATE scores and CFscores for incumbents is 0.93 in the 2016 data).
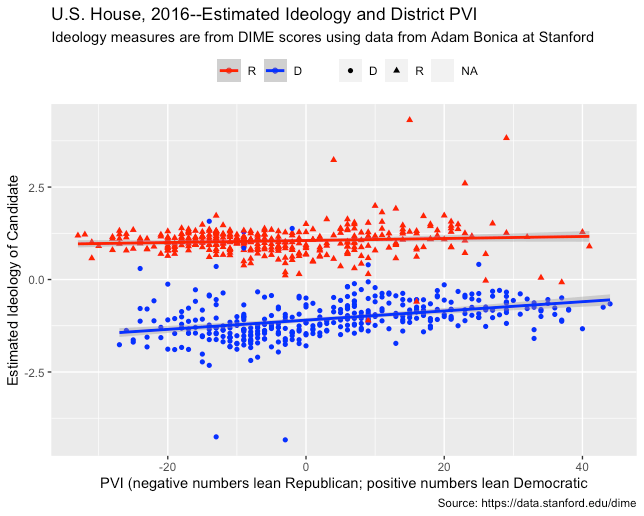
In this case the relationship of x and y is much flatter. Indeed, for Democrats, candidates are estimated to be more moderate as the district becomes more heavily Democratic; and more liberal as the district tends to favor the Republican candidate for president.
Or, if we wanted to replace PVI with Trump vote in the district in 2016, see the graph below. The better Trump did in the district, the more liberal the Democratic candidate in that House race. The effect of Trump vote on GOP ideological positions is flat.
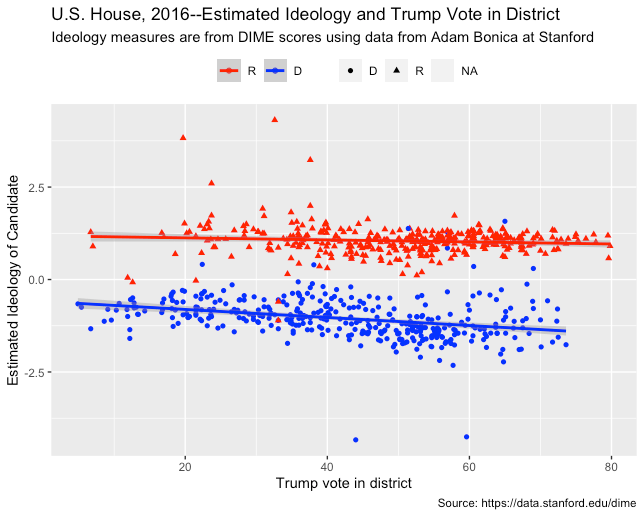
One explanation might be that many “sure losers” ran in those very red districts, running as liberal Democrats just for the value of reflecting the national party platform. So, below I restrict the analysis to candidates who received between 40 and 70% of the vote in the general election, to weed out sure winners and losers. The effect above is still visible, though, meaning the relationship in the graph above still reflects a lack of convergence between candidate ideological placement and district lean. This is one of the key findings of the assigned article, though arguably that effect is even more pronounced in these results.

As a final analysis, I looked at the relationship between ideological placement and final general election vote tallies for the candidates in 2016.

This tends to show a modest moderating effect of higher performing candidates. That is, candidates (both Dems and Reps) generally do better as their ideological position moves closer to the middle of the scale.
I’ll leave it to students in my Gov 2060 class to draw the connections between this analysis and the paper. But I think there is plenty to think about here.
