In my “Campaigns and Elections” class (Gov 2060), we talk a lot about the impact of voting rules on the style and structure of elections. One rule is the “one-person, one-vote” standard.
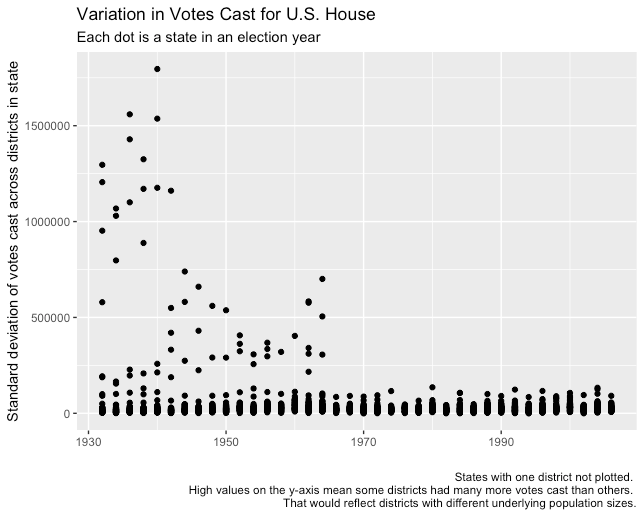
We take for granted the one-person/one-vote standard, but it was only established as a constitutional principle in the 1960s. We can see that in the below graph. The idea is to look at a state’s congressional districts over time. In a set of districts with roughly equal populations (as we have now), the only difference in the number of ballots cast across the districts in a state is variation across districts in turnout. But prior to the mid-1960s, when a number of Supreme Court decisions enshrined the one-person/one-vote standard, districts could be drawn with very different populations, including sometimes the use of at-large statewide congressional “districts.” Thus, the range (or standard deviation in this case) of votes across districts could be vast.
Data source is the Constituency-Level Elections Archive, for election results in the U.S. House between 1932 and 2006.
The requirement that legislative districts be pretty-darn equal in population size (minus the Senate, where variations in constituency size are permissible and Constitutionally protected) has had profound effects, as outlined in the fabulous book, The End of Inequality: One Person One Vote and the Transformation of American Politics.