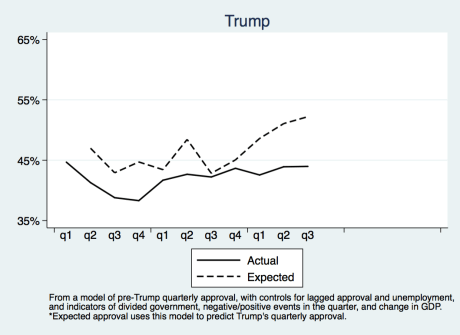
In prior posts I’ve shown some results of a model predicting quarterly job approval for Trump. The analysis uses quarterly approval of presidents prior to Trump to model the effect of lagged approval (e.g., Q4 of last year on Q1 of the next), the political context (i.e., divided or unified government), and economic factors (GDP and unemployment). We can use the predictions from this “pre-Trump” model to compare against actual approval. The results are below.
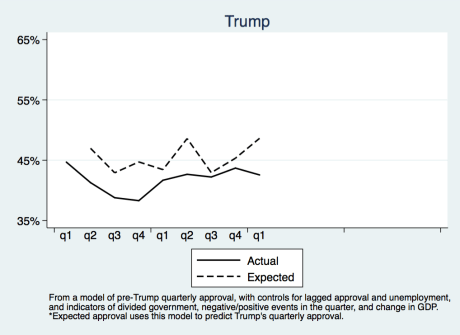
In general, Trump is not as popular as he “should” be. This gap grew in Q1 of 2019 in part because history suggests that presidential approval is actually higher during periods of divided government. Thus, given the hot economy and Democratic control of the House, Trump should have the “perfect” conditions to launch his re-election. And yet, his job approval lags. This suggests something about Trump (something unquantifiable in the model) is dragging him down. That’s not really a surprise, though. I’ll keep updating this every few quarters.
UPDATE: here is the model updated through Q3 of 2019.