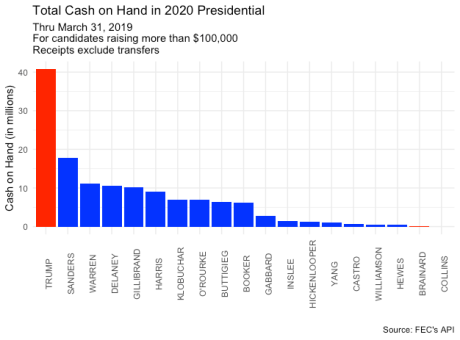
I’ve been using FEC data for years. Recently they launched an API to allow for specific downloads of data. I’ve been playing around with it for a few weeks. And I pulled and graphed the below data from the API.
The advantage of this is that I can run the exact same code after the next filing date and plot the cash-on-hand. This update should literally take a few seconds (unless something breaks); this beats right-clicking on data, saving it, and reading it into SPSS, Stata or Excel.
The FEC’s API has boatloads of data to analyze, and I’ll be digging in to all of that soon.
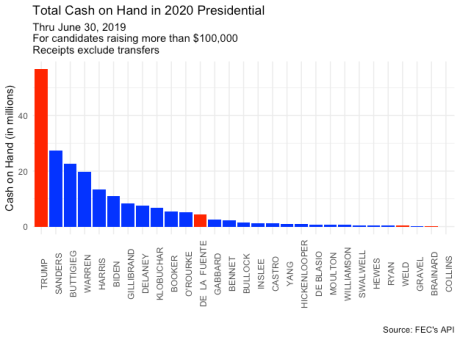
UPDATE: Here is the same graph at the close of Q2 (it took, as expected, a few seconds). Trump is still dominating the field, but Mayor Pete Buttigieg has moved up into third place with over $20 million in cash-on-hand. Note the presence of another Republican, “Rocky” De La Fuente. This is sort of an illusion, though. He loaned himself $4 million at the end of June 2019. In practical terms, he’s not a viable candidate.
UPDATE: And now…the Q3 totals.

