I’m giving some remarks this week at the 7th Circuit Bar Association’s symposium on “Revitalizing Article I.” I’ll be talking a lot about political advertising, but I’ll start with some discussion of the cost of federal campaigns. Here is a portion of my remarks with accompanying graphs.
“I want to talk with you today about political ads, and more generally about the cost of American elections. I have two broad goals with my remarks this morning. First, I want to talk about the challenge of measuring the cost of campaigns, and I want to show you some important changes in election spending over the last few decades. Second, I want to lay out some evidence that the source of those changes have big implications on the health of American democracy and more specifically on the process of considering, drafting, and implementing legislation.
But before I get to the impact of political advertising and spending, I want to talk about how much elections cost. This is in part inspired by a famous political science article published in 2003 titled, “Why is There So Little Money in U.S. Politics?” The authors addressed “Tullock’s puzzle” named after economist Gordon Tullock, who asked a similar question in the 1970s. Ansolabehere and colleagues engage this counter-intuition in part because of the evidence they display in the graph below. (This is not actually their graph but a replication by me using the data they cite to. It is a testament to their good scholarship that I am able to follow their logic in the article and reconstruct this graph from the ground up.)
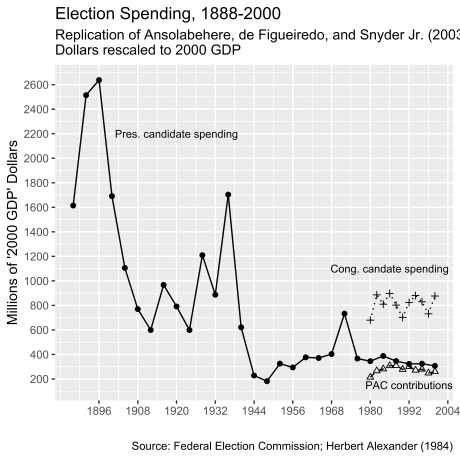
Before I explain this figure, it is important to know that we have good and fairly comprehensive data on federal election spending since the 1970s when Congress passed campaign finance reform and created the Federal Election Commission. Before that, though, federal disclosure laws for election spending were porous and easy to evade. Only from the devotion of a number of scholars in the 20th Century, folks like Herbert Alexander, Louise Overacker, and Alexander Heard, who doggedly collected the information that was available, can we make decent and important comparisons about campaign spending over time.
Ansolabehere and colleagues used the available collections to plot three forms of campaign spending for all of the available data they had through the election of 2000. The first is spending by the major nominees for president between 1888 and 2000. (These are just the two major party candidates running in each year.) The second is congressional spending for general election candidates after 1974. And the third are Political Action Committee (PAC) direct contributions to candidates. (These are not super PACs, but the old fashioned “non” super kind that can make direct contributions to candidate war chests.)
Importantly, Ansolabehere and his colleagues rescale the spending to GDP. They argue that we should look at campaigns relative to the size of the economy in the election year as opposed to simply adjusting spending for inflation. And with that rescaling, they show that presidential spending in 1888 to 1896, and in 1936, far dwarfed spending by presidential candidates since the 1940s. For example, the campaign between Gore and Bush in 2000 featured about $300 million from both candidates across the primary and general elections, whereas the McKinley/Bryan campaign of 1896 cost nearly seven times that amount—about $2.7 billion if we rescale the nominal cost to be relative to GDP in 2000. Moreover, spending by congressional candidates and contributions by PACs to federal candidates was very stable over the 20-year period in their data, showing no sign of being on the rise throughout the 1980s and 1990s.
This claim was very powerful and was widely cited in the political science community in the aftermath of the article’s publication. According to Google scholar, the article has been cited in 1,200 publications over the last 15 years. And it indeed suggests a puzzle. With so much at stake in the policy making process, and a federal government that grew in size through the 20th century, why didn’t the cost to run for office and the money invested to influence policymakers grow at a proportionate rate?
The authors stopped their time series in 2000, but it is fairly straightforward to continue it through recent elections. There is continuity and change in an updated graph (see below). First, congressional candidate spending and PAC contributions do not track up or down in any significant way. However, presidential candidates since 2000 have spent between two and three times more than candidates running between 1988 and 2000. This change is largely the consequence of the decline of the public funding system that characterized presidential campaigns since the early 1970s. That public funding scheme was a voluntary one, and it collapsed when candidates realized the potential of raising significant sums somewhat quickly through the Internet. The campaigns of Obama, McCain, and Romney were the most expensive ones of the 17 elections between 1940 and 2012.
Still, the bigger message of even an updated graph is that campaigns are not increasingly costly affairs. 2016, for that matter—for an open seat White House—was a cheaper election than the one four years prior.
And yet, something doesn’t quite seem right in ending the story there. For one, the numbers exclude a whole lot of data. Even passing observers of politics have likely heard of McCain-Feingold, Swift Boat Veterans for Truth, soft money, Citizens United, and super PACs. All of that spending, including others such as on the party conventions, by political parties directly, and by many primary election candidates, are excluded from the original graph. By including more spending in the totals, and collecting as much data as we can comprehensively get a handle on, we can show that spending in midterms and presidential elections since 1990 have tracked upwards significantly. Midterm spending between 1990 and 2018 doubled, with 2018 being the most expensive midterm election in the time series. And it is important to remember that I have rescaled this spending to reflect changes in GDP. So this doubling exceeds changes in real spending—which is to say, even as the economy has expanded in the last 30 years, spending on campaigns has outpaced that increase significantly.”

