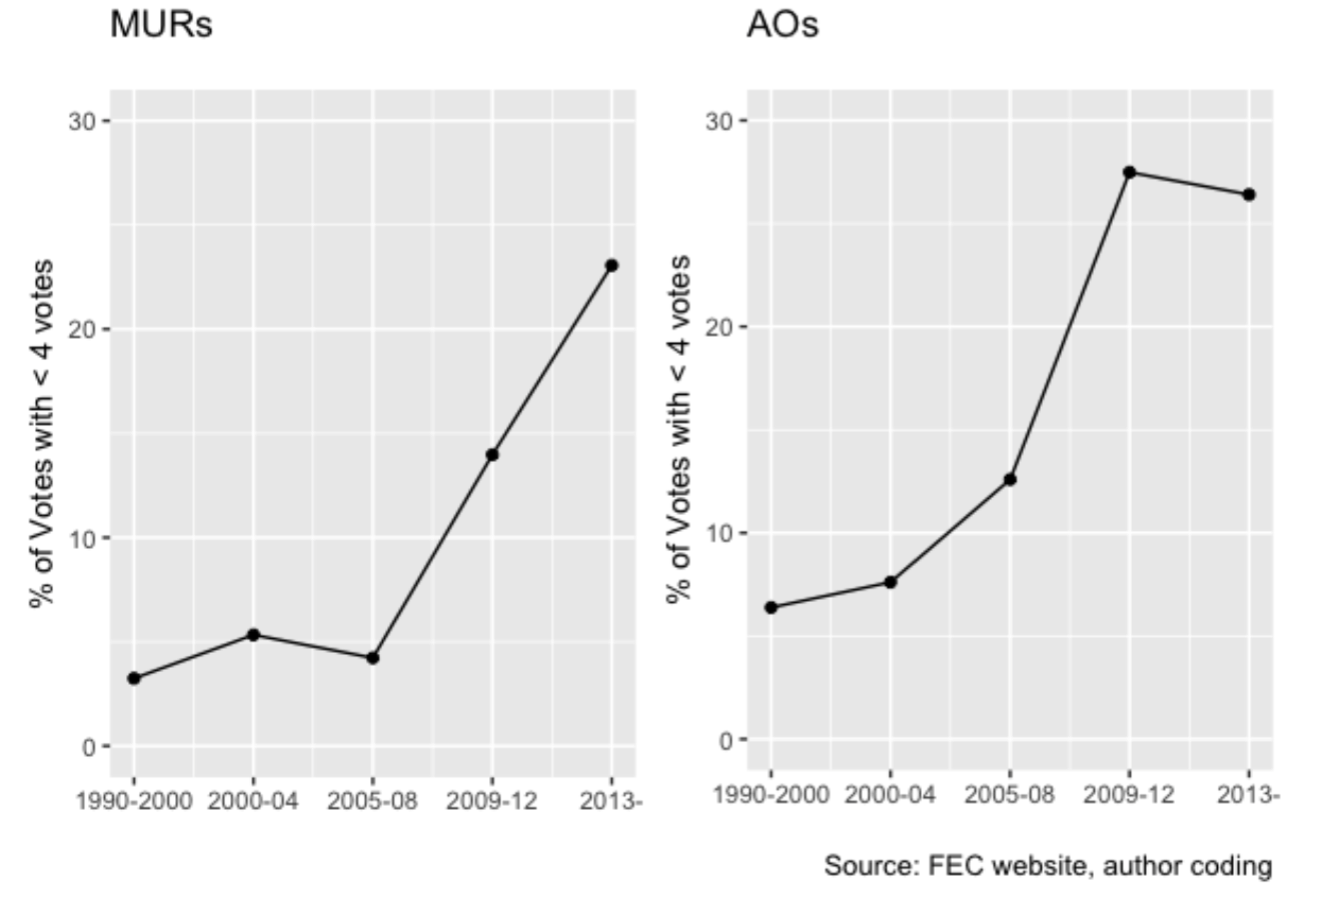
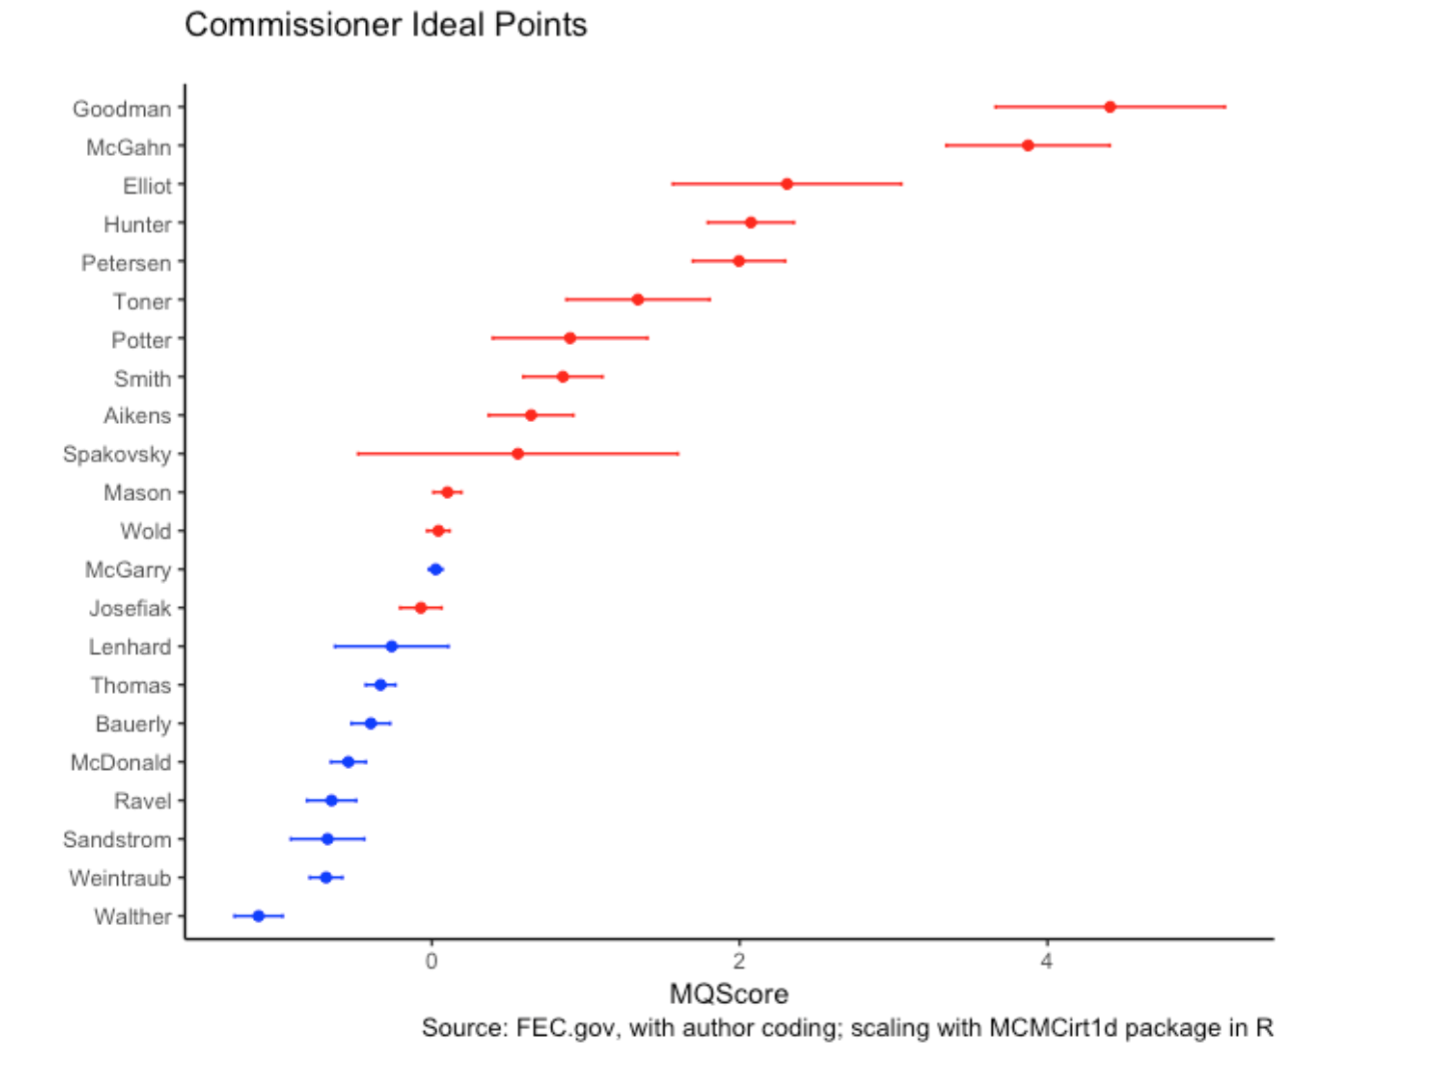
I’ll be presenting some new research at the American Political Science Association conference in Boston on August 30. It involves some data I’ve collected on the Federal Election Commission. The paper is here, and two relevant graphs are below. The first shows the percentage of FEC votes that end in “deadlock,” where less than four commissioners vote for a proposal. The FEC is comprised of six commissioners, with no more than three from any party. (I look at two forms of data: advisory opinions [AOs] which provide legal guidance from the Commission; and enforcement cases [MURs] which investigate potential violations of the law.) The second uses 30,000 commissioner-level votes to estimate ideal point scores (which one can interpret as the ideological “lean” of the commissioner) for 22 commissioners (using data back to 1990). The x-axis moves from more liberal to more conservative.
The analysis is a work in progress, and more details are in the paper. I’ve long been interested in the FEC, which is charged with regulating and enforcing federal campaign finance laws. I’m excited to present this research and get feedback on the analysis.