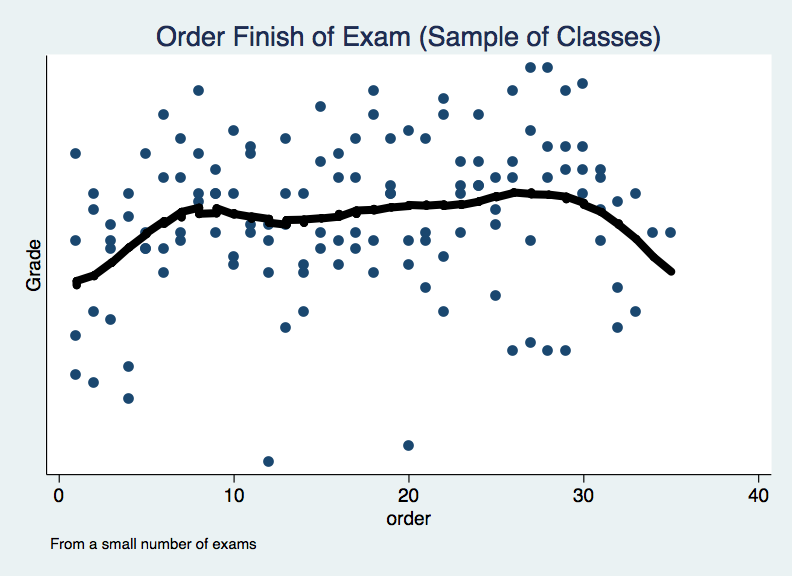
Over the years I have tried many different exam formats: the traditional in-class with blue book vs timed take-homes, for example. In some years when I’ve done the more old-fashioned in-class exam, I’ve taken to noting on the back of completed exams the order of completion (i.e., the student done first is 1 and the last student is n). For the handful of times I’ve done this, I plot below the order of completion and the exam grade (unscaled across semesters and exams).
There is not really much of a pattern here, except to suggest that the students who complete the exam first and last are often the lowest performers. Other than than, it seems pretty even-steven.
I should note that I’m plotting this only for older semesters, where the students have long since graduated. These patterns could certainly be different in more recent years.