I’ve been playing around with some presidential approval data back to the post-war period. The data are aggregated to quarters in each year, such that all available polls in a quarter produce an “average” approval rating from in- and out-partisans.* The results are graphed below, which includes the first quarter of Trump’s presidency and all available polls in the on-going second quarter. We are at near-historic levels of polarization, as should be evident to even casual observers of American politics, and that’s evident in this graph. Out-partisans (Republicans in Obama years and Democrats today) dislike the president at rates unseen since 1951 and 1952 (the end of Truman’s presidency).
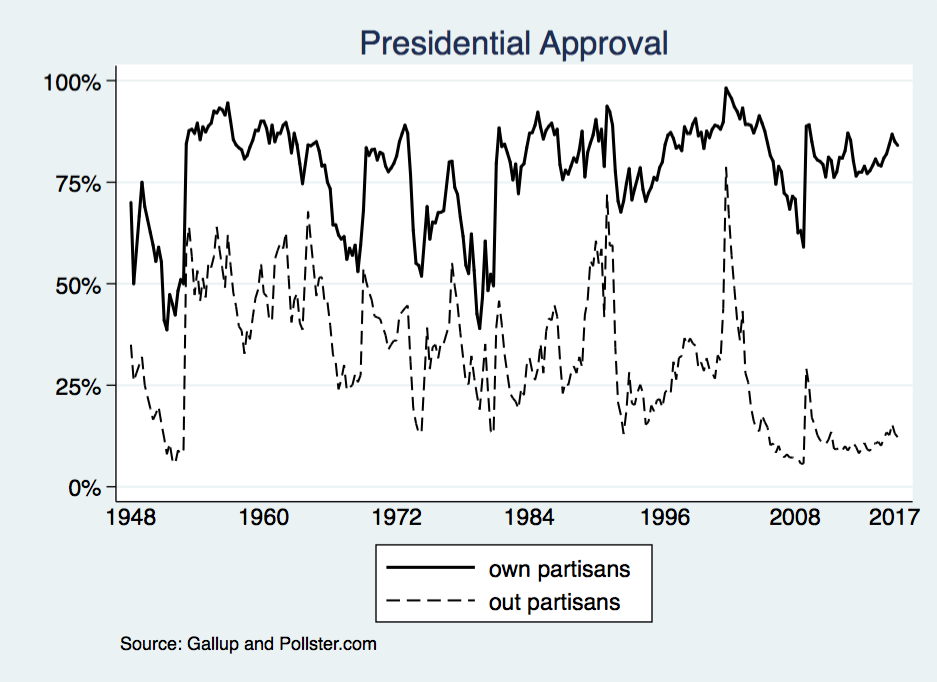
*In these aggregations, polls of “likely voters,” “registered voters,” and “adults” are all group together.
