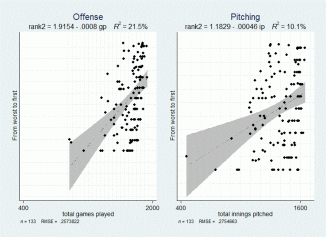
It’s almost here. And I’m a sucker for it. I’ve been in the same league for over 10 years with friends from college. And every year I produce an updated version of the below graph. It shows the performance of each team in each of the last 11 seasons. The plots show the final standing of each team against the number of total games played by their fantasy hitters and the number of innings pitched by their fantasy pitchers. The story here…more games played and more innings pitched are strongly correlated with doing better in the league. Duh?!! But….the fit for offense (the R^2 value) is twice as good as the fit for pitching (though let’s be honest, both are pretty bad in explaining outcomes simply and efficiently). I take this to mean that I should spend my early picks in the draft on hitters over pitchers–they are more predictable (so long as they aren’t injured; yep, that means I will never draft Hanley Ramirez again). The draft is this weekend. Wish me luck.
- Comment
- Reblog
-
Subscribe
Subscribed
Already have a WordPress.com account? Log in now.
