In November 2025, Maine voters weighed in on two ballot measures: Q1 asked about restrictions to voting, including changes in access to absentee ballots; Q2 asked about a red flag law for gun access. Q1 failed, with 64 percent of voters opposing it. Q2 passed with 63 percent of the vote. In the partisan world we currently live in, both ballot measures were infused with partisan angles. Democrats strongly endorse expansive voting access and also approve of more gun laws. Republicans tend to take the opposite perspective. One question, then, is whether the partisan composition of different cities and towns in Maine was strongly related to the way voters cast ballots in 2025. In one sense, this seems obvious. But in another sense, Maine voters have historically endorsed more options to vote than less. When Republican legislators in the Maine government over-turned same-day registration in 2011, for example, voters promptly restored that option in 2012. So it may not be obvious that more Republican towns would endorse Q1 in 2025. It may also be the case that concerns about gun violence (especially after the Lewiston shootings in 2023) cut through the partisan frames in Maine.
But “partisanship is a helluva drug” and a lot of today’s political controversies are passed through the lens of party politics.
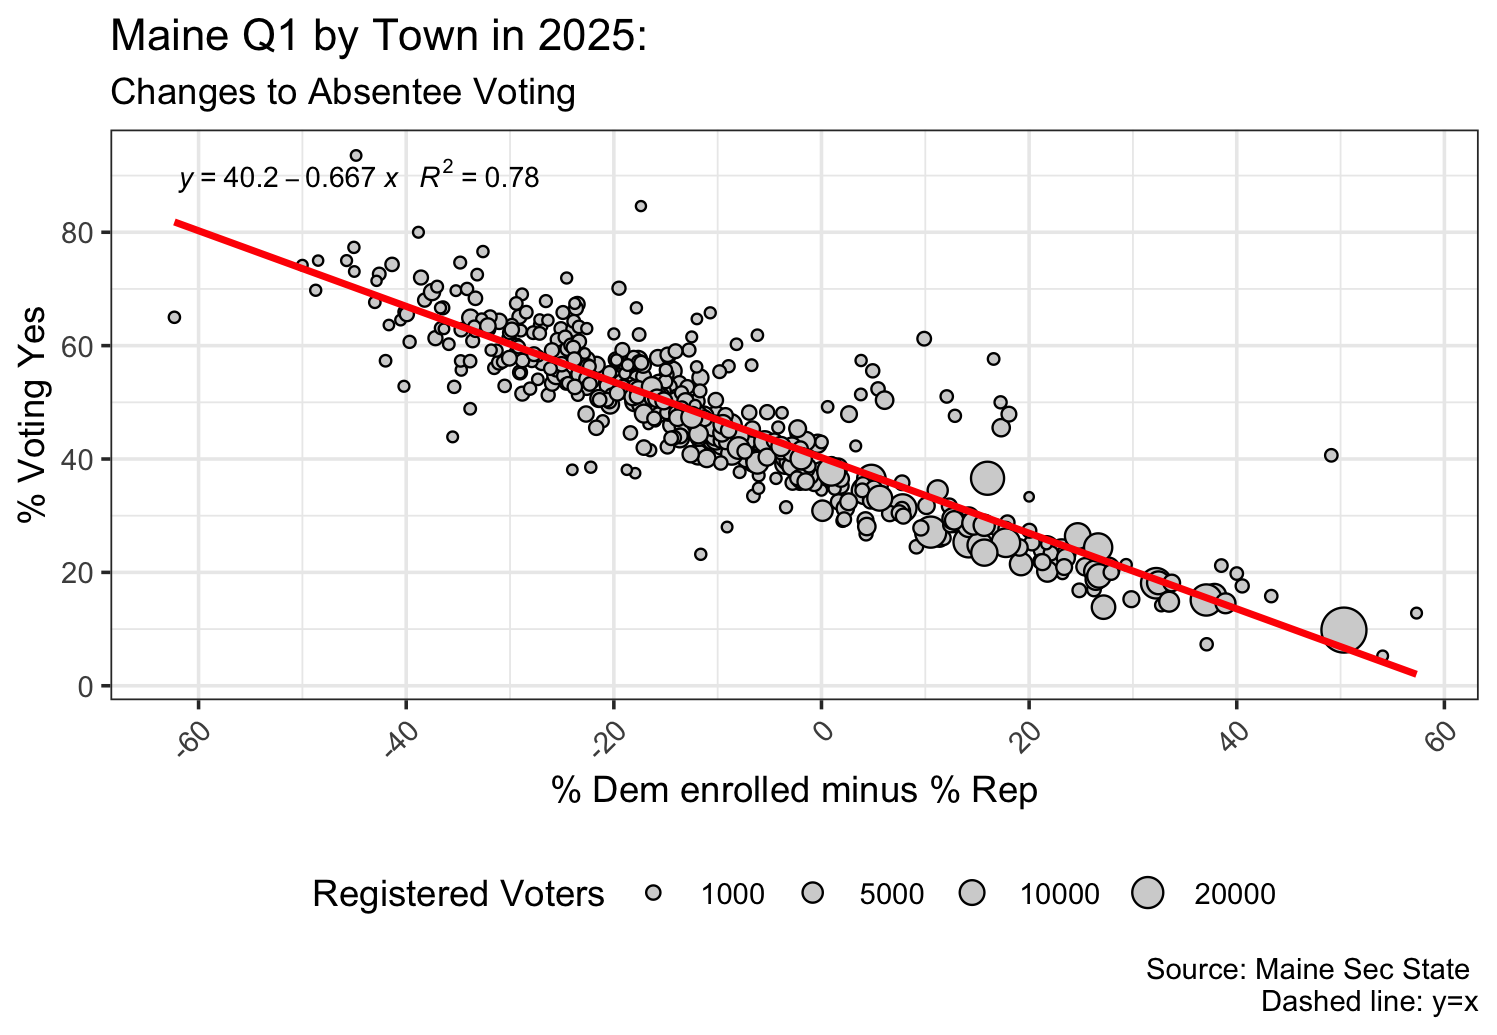
I grabbed the town/city level elections results from the Maine Secretary of State’s website, along with party enrollment totals by town. For the latter, I calculated the percentage of enrolled Democrats minus the percentage of enrolled Republicans. Negative values indicate towns with a higher share of Republicans and positive values indicate a higher share of Democrats. I compared that measure to the percentage of voters in each town and city who voted yes on Q1 and Q2. The plotted points on the graphs below are scaled larger or smaller depending on the total number of registered voters in 2025.
Here is the relationship for Q1, which shows a very strong and linear relationship with partisan enrollment and vote outcomes.
The same is true for Q2, with higher Democratic towns and cities voting “yes” at higher rates.

As you might expect, the relationship between Q1 and Q2 is incredibly strong, as indicated below. For each point increase in the “yes” vote for Q1, there is a nearly 1-point decrease in support for Q2.
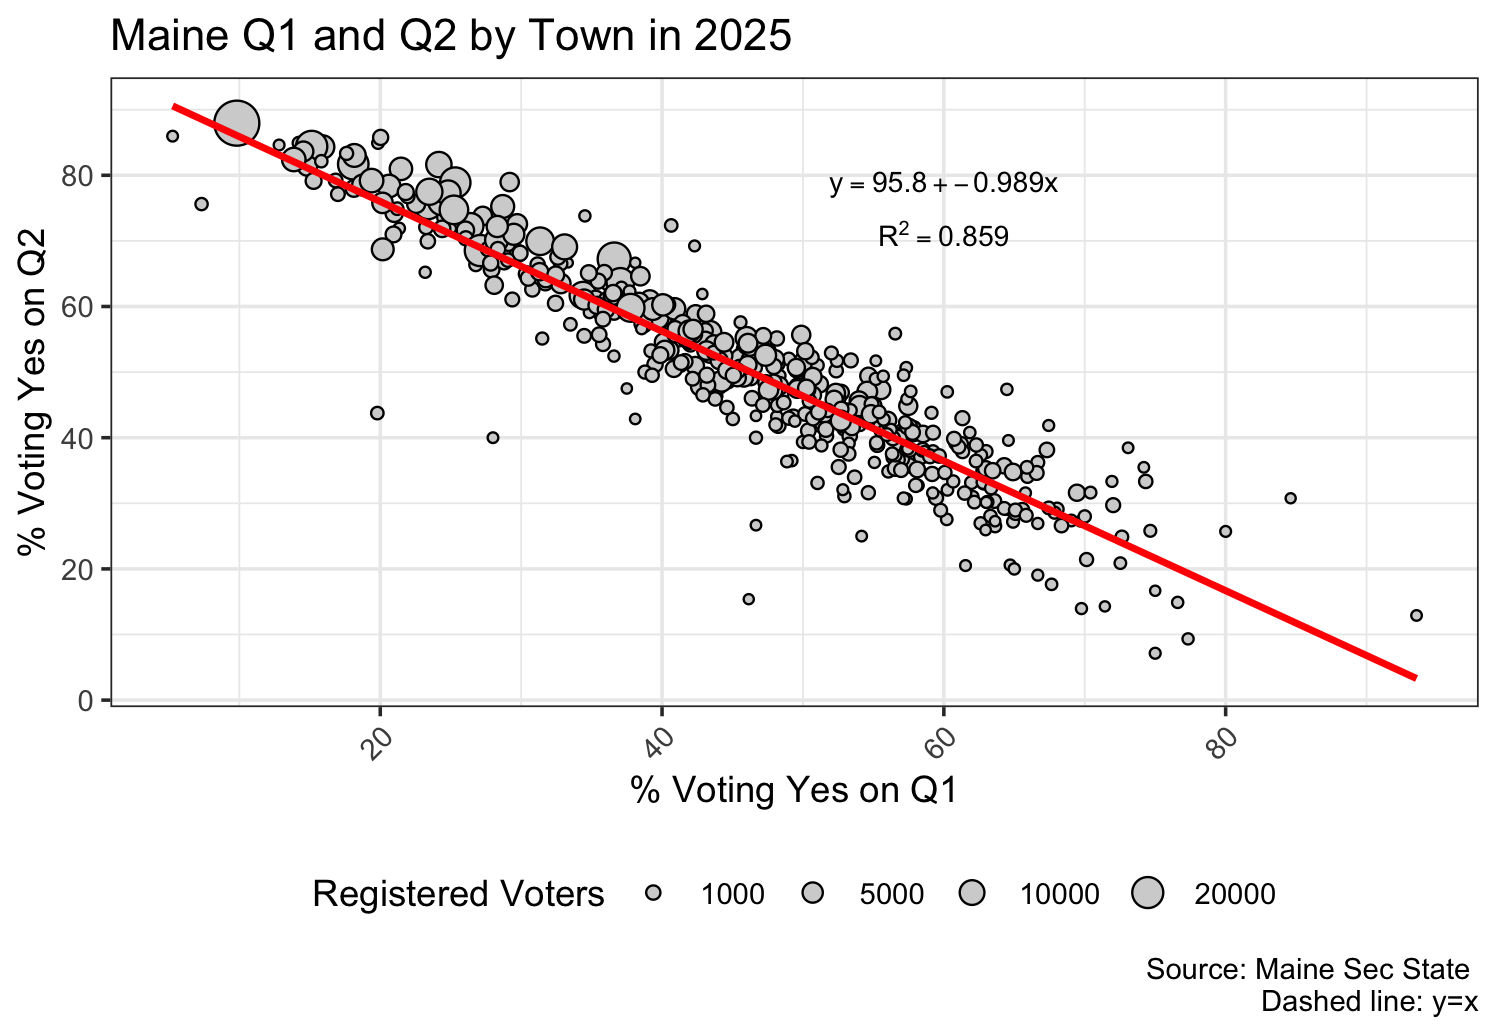
It is not always the case that voting on one ballot measure will strongly predict voting on a separate ballot measure. Q1 and Q2 were conceptually unrelated, in fact. But from a partisan perspective they were deeply linked. And voters acted accordingly.
