In many ways the decisive outcome of the presidential election on November 5 was surprising. Many expected the election to be closer and for the count in battleground states to take multiple days. On the other hand, the outcome makes sense given voters’ expressed frustration with the economy in general and inflation in particular. Plus, President Biden is very unpopular, and the Vice President did little to separate herself from the administration. For this latter explanation, we often call these broader, contextual factors the “fundamentals” underlying the election. Put simply, given President Biden’s current approval rating we might expect the challenging party to win (or come very close).
I was thinking about this given some data I collected recently on Biden’s approval rating. In The Gamble by John Sides and Lynn Vavreck, they run a statistical model predicting quarterly presidential approval and compare the “predicted” approval rating of Barack Obama to the “actual” approval rating for each quarter of President Obama’s first term (Figure 2.4 in the book), finding that Obama had slightly higher approval ratings than the model predicted. He was, in that sense, “more popular” than the model expected, albeit by a small amount. John Sides shared the data with me, and I updated the data to include the Trump and Biden years. Using a model of presidential approval pre-Biden, I created a similar comparison, shown below.
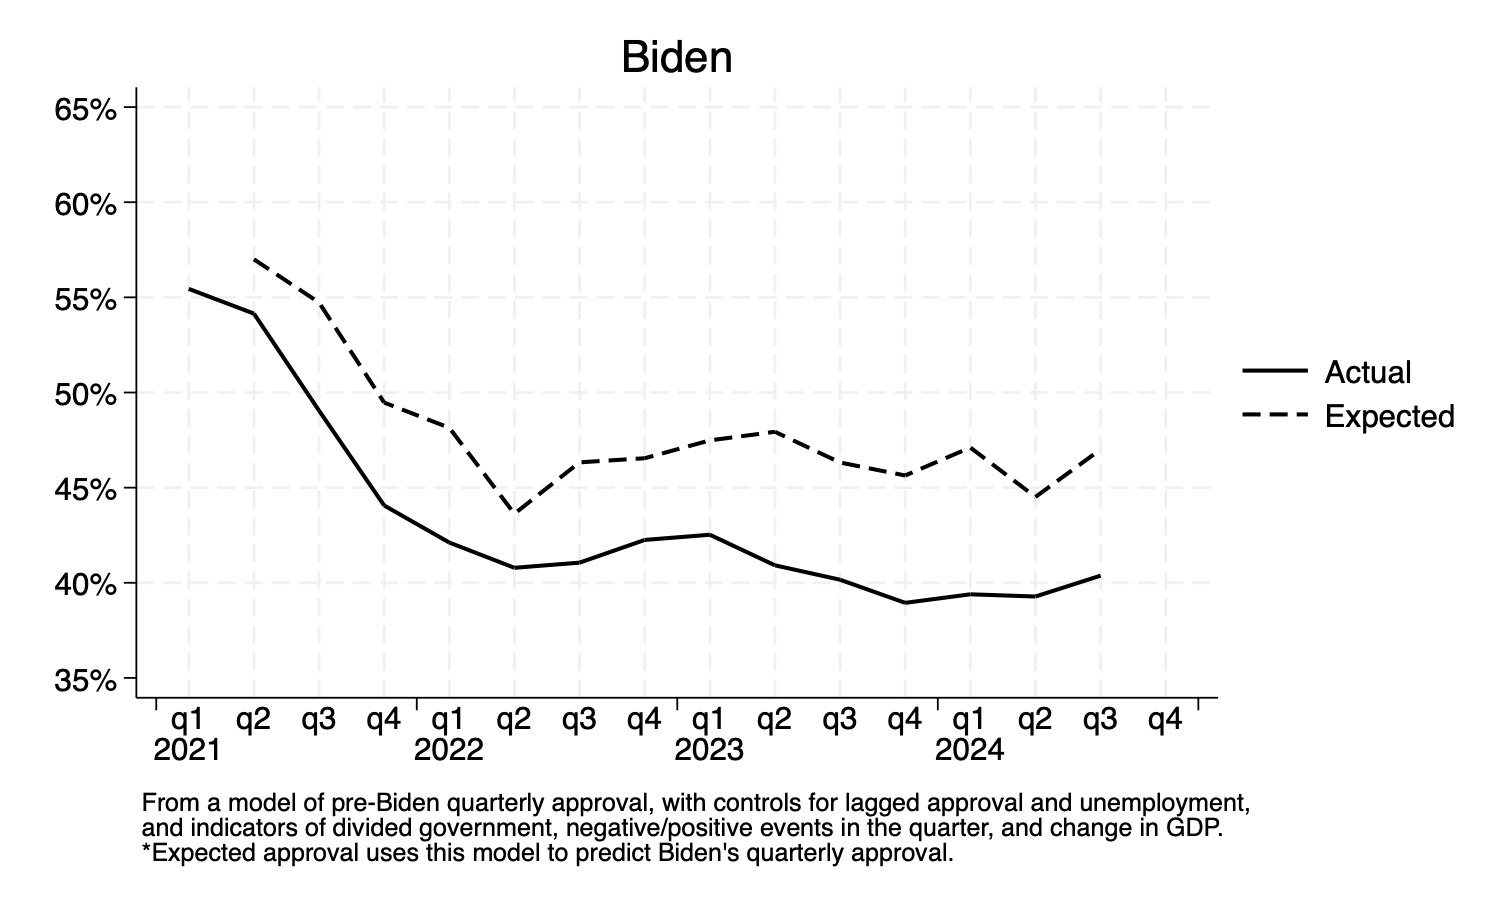
We often treat the “actual” approval as one measure of the fundamentals. But presidential approval is itself a function of other factors/fundamentals, which we expect to do a good job tracking approval ratings. For Biden, though, the model systematically over-estimates where his approval should be given economic and political factors.1 In other words, he took a penalty of sorts for certain factors not included in the model. What explains the discrepancy in the graph? There are a lot of potential culprits–media fragmentation, partisan media, affective polarization–take your pick.
Biden’s actual approval rating tracks pretty well with the outcome. See the green dot in the graph below. Using data from 538, his average Q3 approval was about 41 percent, and the election falls pretty close to the regression line (as of this writing Harris has 48.2 percent of the vote; the regression line predicts her getting around 49.4 percent of the two-party popular vote). This would suggest the fundamentals (one measure of it, anyway) do a good job of explaining the outcome–or at least the over/under on 50-percent of the popular vote. But what if we considered Biden’s expected approval? If his approval reflected what we would expect given political and economic factors, we might predict Harris to get above 50-percent of the two-party popular vote. And this is no trivial difference. She lost Wisconsin, Michigan, and Pennsylvania by around 1 point, give or take2. If she won those three states, she would have received 270 Electoral Votes.

This is just a though experiment and back-of-envelope, of course. But it also signifies the limits of saying “it was the fundamentals, stupid” and leaving it at that. The fundamentals matter a lot, but partisanship has also impacted how we assess the president and view the economy. If President Biden had an approval rating that reflected current unemployment and GDP growth–if, in other words, objective measures of the fundamentals predicted other, more subjective measures–we might be talking about President-elect Harris.
- These political factors are negative and positive events that are expected to hurt or help the President in a quarter. The complicated removal of troops from Afghanistan in 2021, for example, would count as a negative event. Coding for these are subjective, but I tried to pick clear-cut events or presidential decisions that would be expected to factor into the public’s evaluation of the president. ↩︎
- Close to 2 points in Pennsylvania. ↩︎
