As part of a research project with a Bowdoin student, we are collecting pre-election House and Senate ratings from a variety of sources. I recently grabbed the 2024 ratings from Wikipedia, though they include links to the underlying sources where we can verify the data. In 2024, we found ten different sources for election ratings, including places like Cook Political Report, Larry Sabato’s Crystal Ball, and RealClearPolitics (RCP). They tend to rate elections on a scale from Safe Democrat to Safe Republican, with categories in between for variations of competitiveness. The full scale is most often:
Safe Democrat…Likely Democrat…Lean Democrat…Toss-up…Lean Republican…Likely Republican…Safe Republican
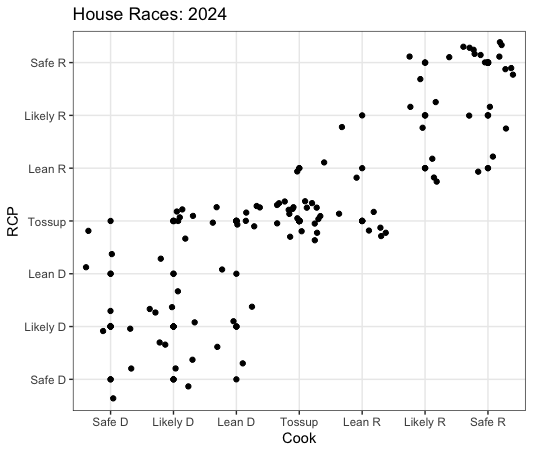
One of the goals of our research is to compare election ratings against election ratings. Below is one example, where we compare Cook Political Report against RealClearPolitics. To be included in the data, two of the ten House raters must disagree on at least one House race. If all ten agree on a rating, it is not included in the data posted on the Wikipedia page.
In general, RCP and Cook agree on the party direction of the races. In no cases does Cook see the race as leaning to the Democrats while RCP sees it as leaning to the Republicans (and vice versa). They largely disagree (when they do) in two ways: 1) on the level of competitiveness. Cook might see the race as more likely Democrat while Cook might see it as more competitive, as a lean Democrat. Additionally, 2) they sometimes disagree on whether a race is a toss-up. When Cook rated a House race as a toss-up, RCP almost always agreed. But when RCP rated a race as a toss-up, Cook often assigned in a pro-Democratic or pro-Republican direction.
All told, we have similar data for election ratings back to 2006. And we are examining House and Senate ratings using data from Congressional Quarterly back to 1964. It’s a fun project.
